Project dashboards: The next level of project analytics
Wave goodbye to tedious reports. Our new project management dashboards are easy to build and use, boost visibility, and offer instant actionable insights to managers and execs.
TRUSTED BY 20,000+ ORGANIZATIONS WORLDWIDE
Next-gen analytics at every level
Whether you need individual, team, or executive dashboards, Wrike supports use cases for your team.

Analyze and report on marketing performance
Monitor campaign progress and show your team’s impact with a visual snapshot that’s easily shareable. Track performance with dashboards that analyze the data for you.

Simplify client management
Access real-time data across your client and project portfolio. Report on capacity, effort, budget, and time tracking metrics for heightened productivity.

Get complete project portfolio visibility and control
Use dashboards for enhanced project tracking, creating new opportunities for workflow optimization and operational efficiency.
Highly visual, data-rich project dashboards
Get a detailed overview of project data and team progress with Wrike’s new dashboards.
Personalize dashboards to get the info you need
Tailor your dashboards to reflect your business objectives and track corresponding data accurately with customizable widgets, including calendar and chart views.
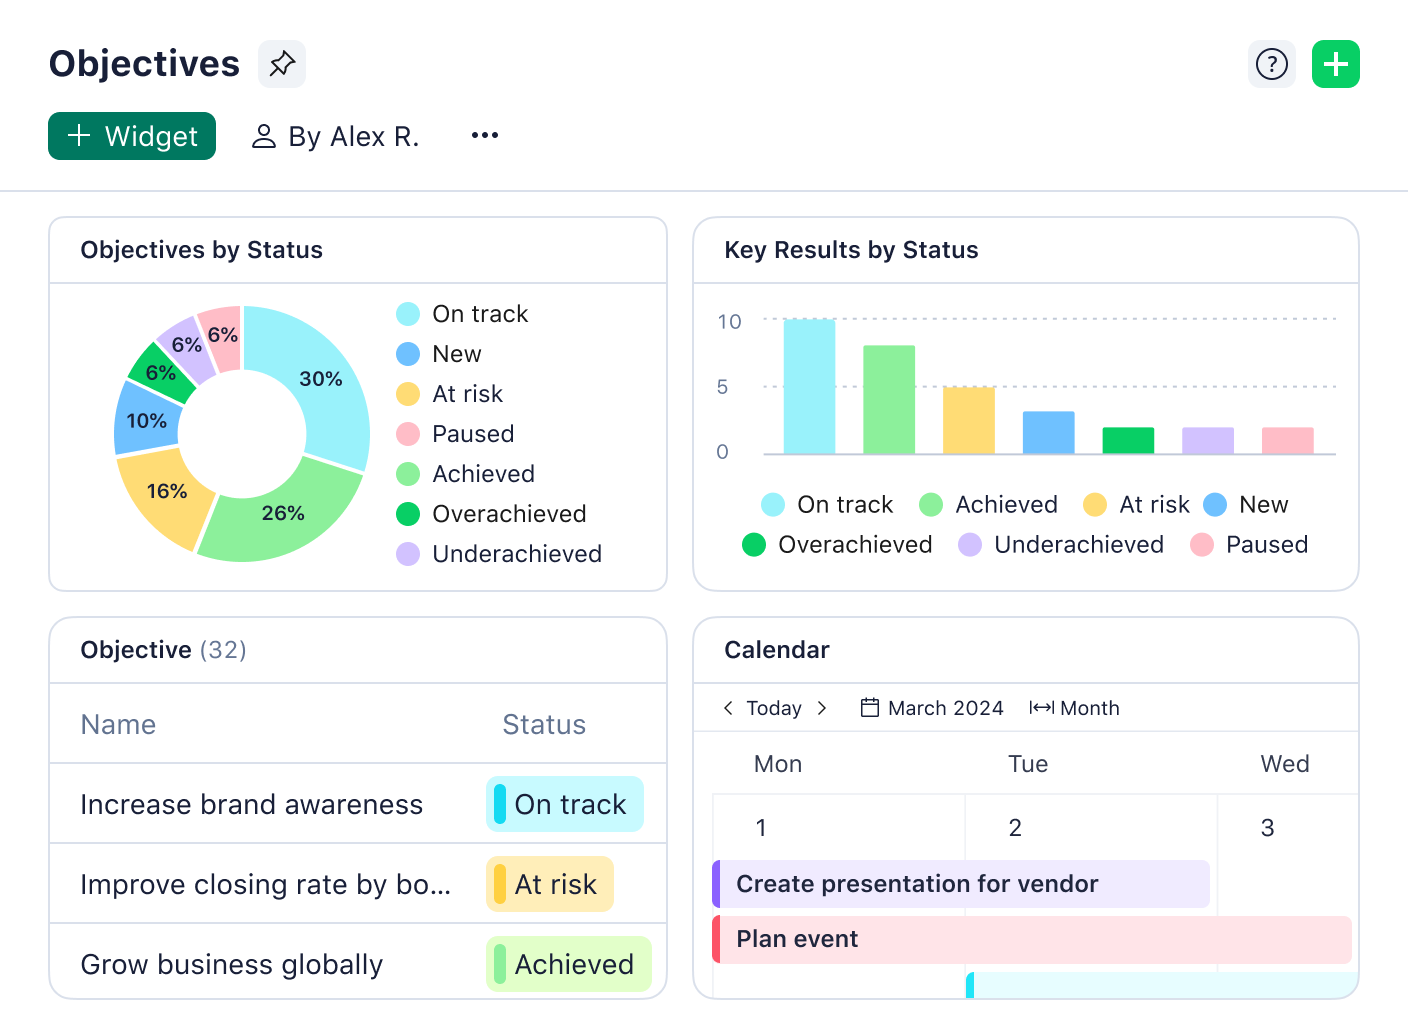
Work cross-functionally
Connect data insights across all workflows and teams in Wrike. Easily collaborate and share dashboards between Wrike and non-Wrike users.
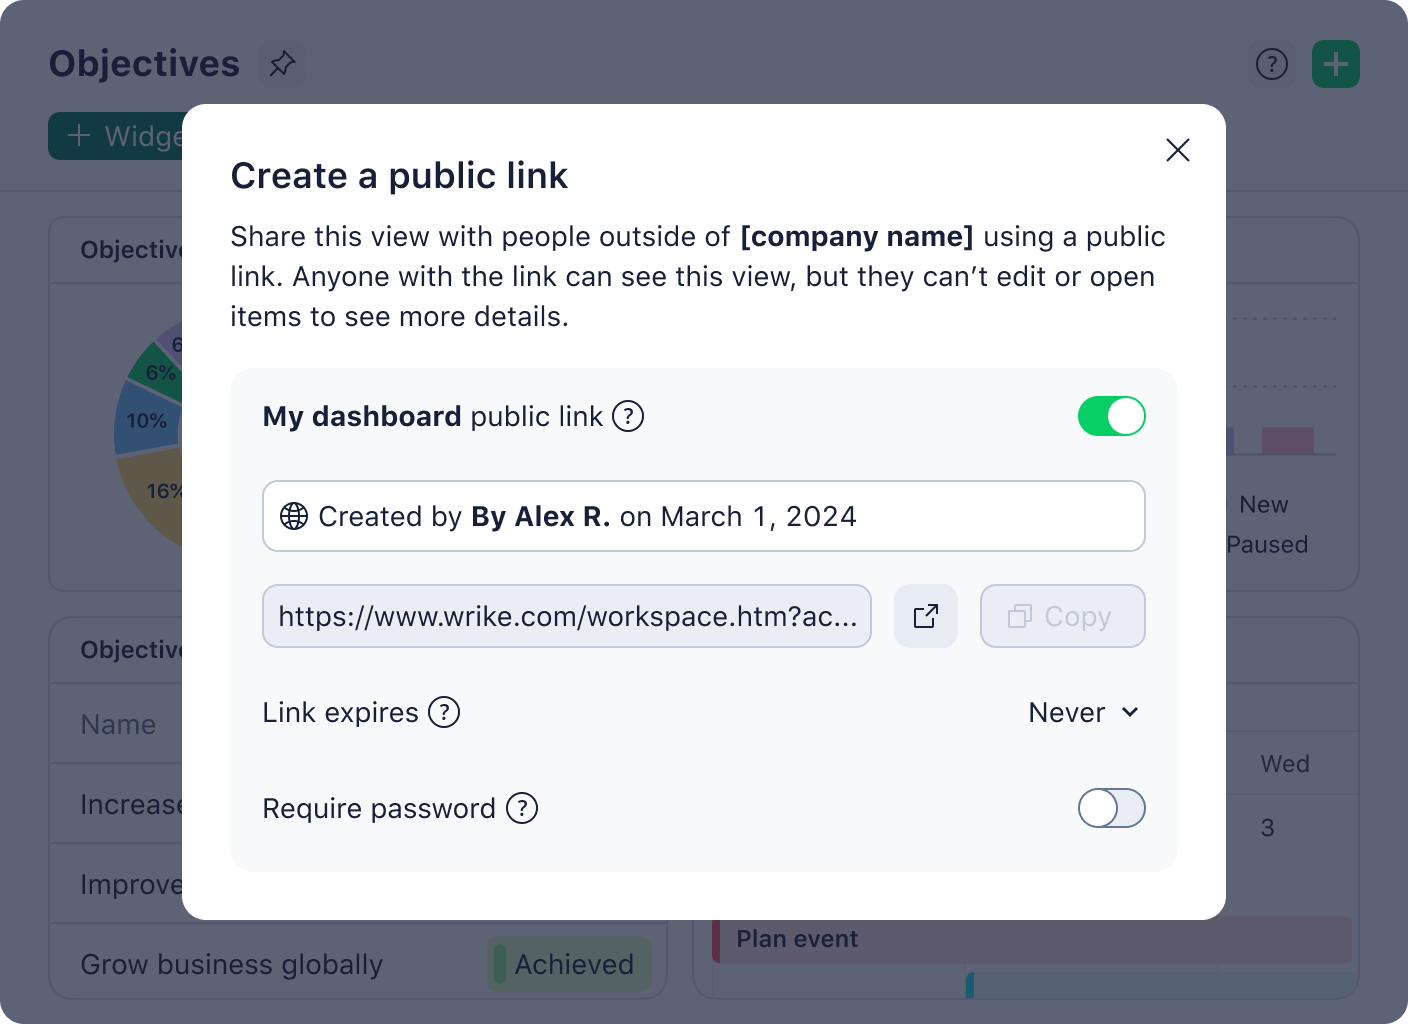
Amplify insights with interactive widgets
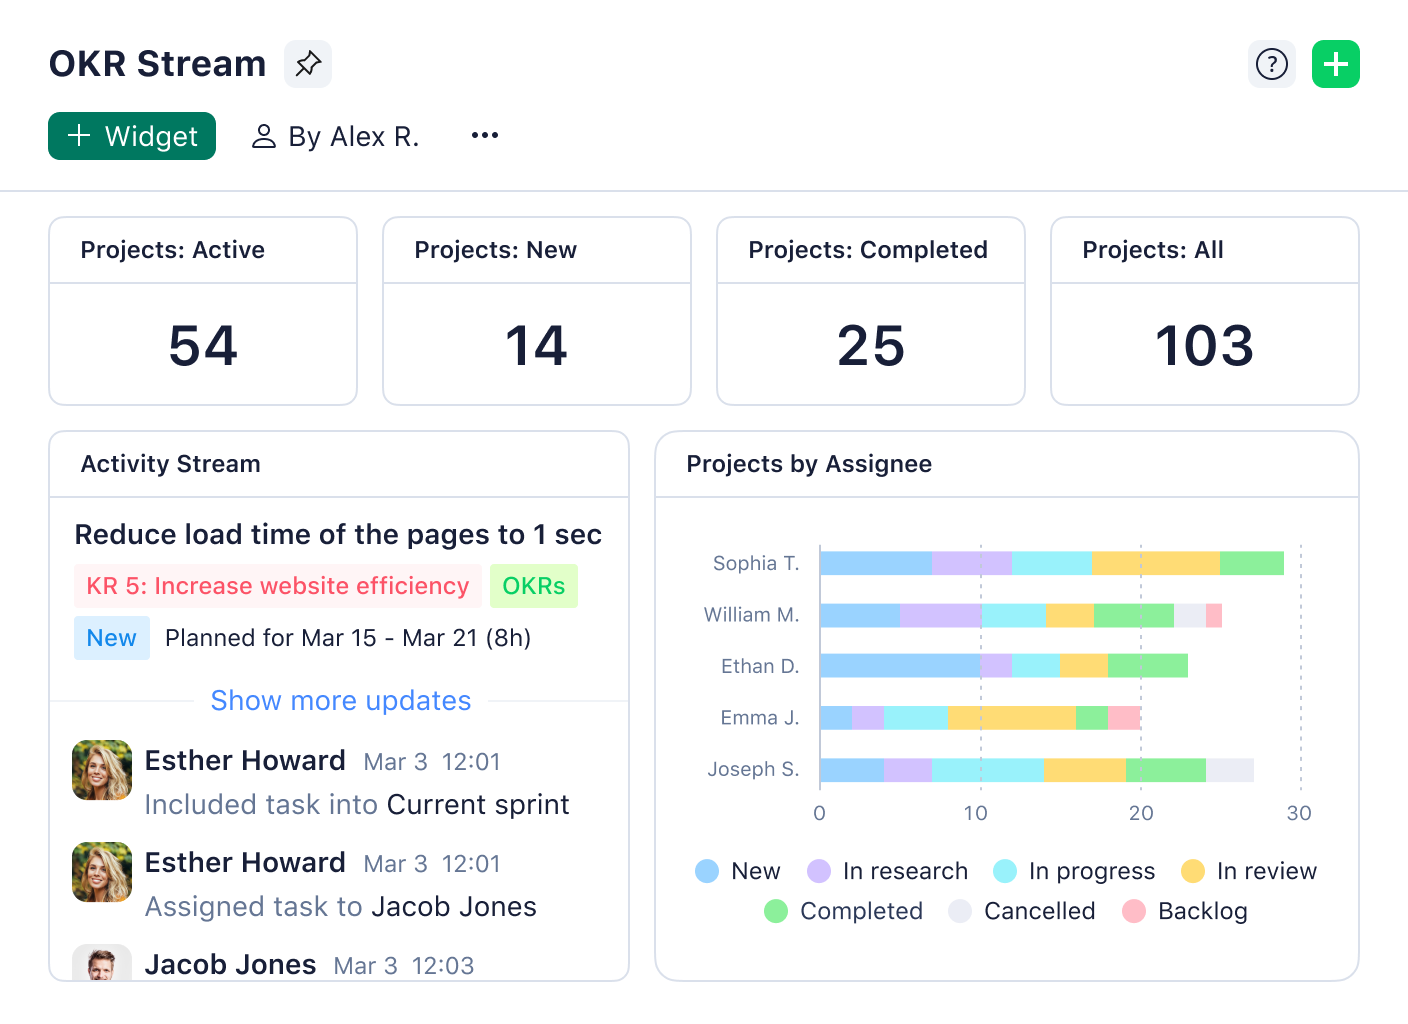
Visualize critical data in real time with our dynamic activity stream widget. This new feature allows you to see every task and project update chronologically.
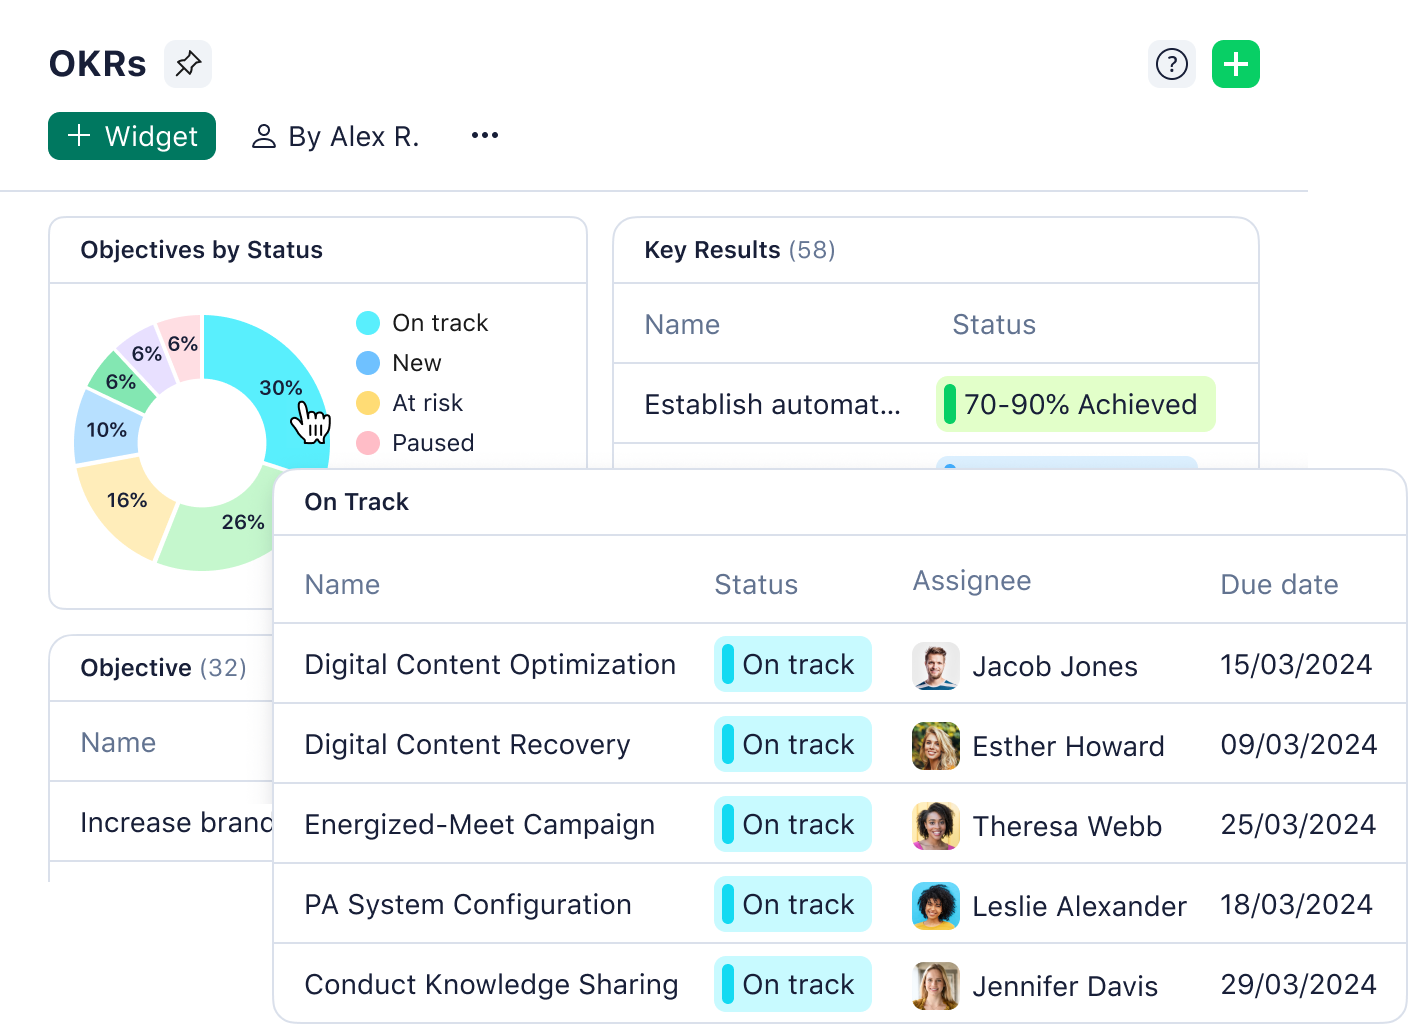
Align work projects with company strategy
View programs that align with overarching company goals and easily drill down into individual project progress and team activities.
The next generation of Wrike dashboards
Customize your project management dashboard with new widget options for better project tracking and analysis.
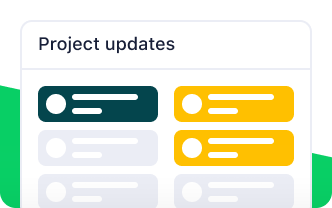
Activity stream widget
Experience collaboration at its finest — get instant visibility into all project activity in chronological order. Save time with a quick overview of ongoing activities AND visualize how the activities impact overall initiatives.
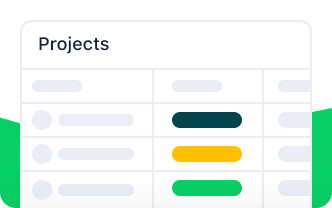
Pivot tables
Pivot tables are your trusty sidekick in quickly summarizing large piles of data. Use them to save time and anticipate questions for big meetings in a snap.
Over 2.3 million users choose Wrike

Dashboards eliminated a lot of the stress and time spent trying to pull summaries of what everyone was working on. We start every week using our dashboards — it sets the bar for what we must prioritize.

Wrike offers some helpful, out-of-the-box features that are essential for enterprise use. We set up the dashboards so collaboration and task management work best across functional teams in branches.

I was instantly able to remove four hours of meetings a week through the use of shared dashboards. I refocused this saved time on providing education opportunities for the team, which improved our process for project initiatives.
Use your other favorite Wrike features with new dashboards
New dashboards enable you to gather everything individuals, teams, and execs need to succeed in one place.
Custom views
View the info you need in any format, from pivot tables for in-depth data analysis to activity streams for day-to-day updates.
Advanced analytics
Display information in more advanced views like scatter plots with advanced analytics.
Custom fields
Filter and calculate information from custom fields and display them in any of your dashboard widgets.
Get better results with next-gen analytics
Bring multiple charts and views together in one project dashboard, for easy data visualization and more informed decisions.


